Been looking at styling options for Matplotlib Charts. There are
three recognized approaches: 1- Using pyplot; 2- Using a
stylesheet;3- Using rcParams. Because I am working on pandas, I can access
some pyplot functions directly - Pandas act a wrapper on pyplot - and use
plt for the rest.
My freeform example. I can define the index directly.
.PNG)
.PNG)
CLASSIC

BMH
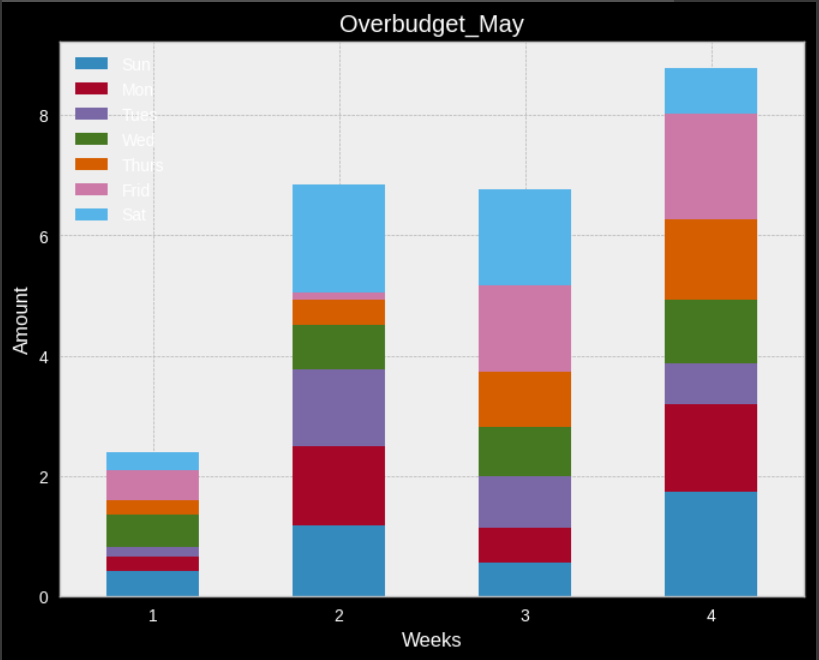


DARKBACKGROUND

No comments:
Post a Comment