The Globe and Mail, today, showing a series of Associated Press photos
from Gaza:

* * *
I have been asked to explain about information and breaking symmetry in
TensorFlow Deep learning from the playground widget.
Column(1) is the axes that defines the datapoints. X1 is the axis with 0 in the
middle; X2 shows middle zero on the veritical; X1 squared will square the
values of the first axis; X2 squared, those on the vertical; follow sin(X1) and sin(X2).
Blue backgrounds are then areas of positive values, and orange negative ones.
Depending on our choices, any of these graphs can feed the next column of neurons.
.PNG)
Chatgpt on weight assignment:
.PNG)
.PNG)
.PNG)

We choose a learning rate, an activation function, proportion the train and test data and
we are good to go. Given that we can 'see' the dataset, the fun part with this widget is
choosing how extensive data input and layers of neurons should be...
With data in terms of the two X-axis only, this model can't seem predict that all the
positive ones are situated in the center of the space.

We need to add more information, so that the model can discriminate. Here a thread
that shows squared values with respect to graph 1.
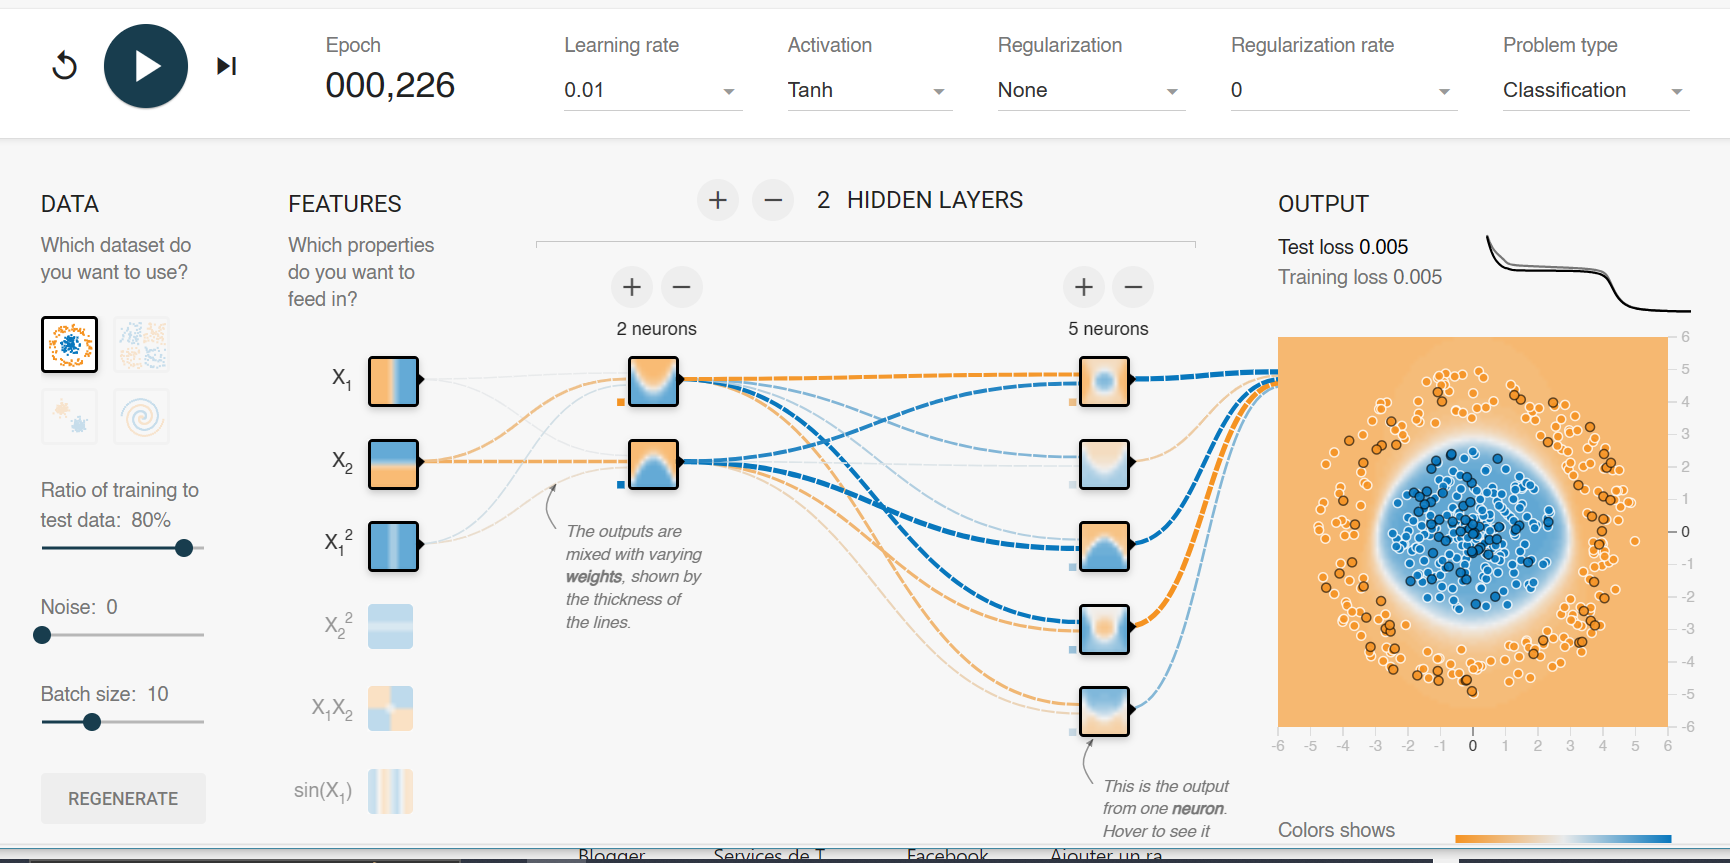
(Works equally well using graph 4 in the absence of graph 3!!)
* * *

No comments:
Post a Comment