Installed Bandicam screen recorder, and sarted working with the
debugger in PyCharm, to better see how the code in our fractal tree runs.
Below, run1:
The red dots are the breakpoints on the debugger, asking the program to stop.
Here, I've ended up just running 'stepover' continuously. One gets to see how it is
always the first function, with a decreasing length variable, that runs over and over
until the condition is met.
We are then forced to backtrack - in green - with serial attemps to go forward again...
* * *
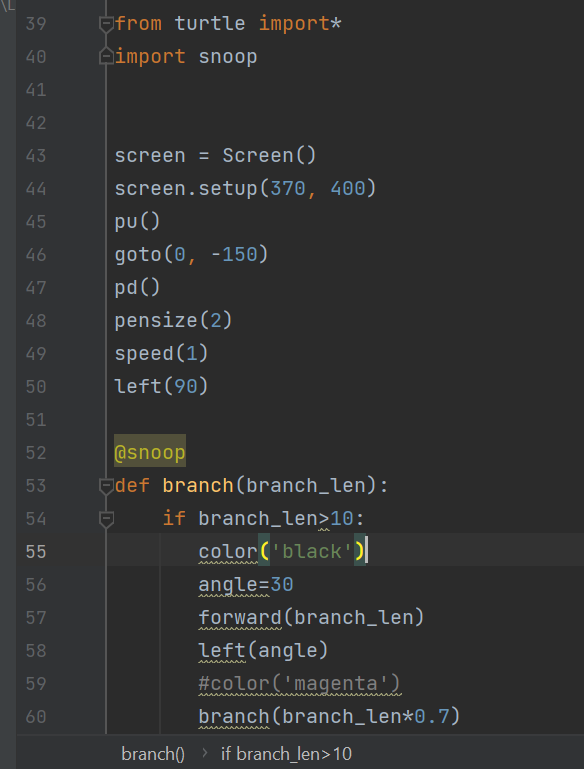
I was asked to explain why the tree only branches in twos. This eventually led me
to download a very powerful tool to look at the execution of the code. It is called
Snoop; can be installed with pip, and run with an import statement and a snoop decorator.
The output is what happens at every step of the code...

Thr clue to th whole thing seems to that - once the condition is triggered - control
goes back to the lst call to the branch function, which is then stepped over!
No comments:
Post a Comment