Thursday, November 9, 2023

Snow!!

 Hey, it's snowing!!


Octave is a programming language, and I asked Bing/Chatgpt to do the code:


                                                        *     *     *

Added more terms, but things are crowded...


By defining x = 4:10; I am getting a zoomed-in view:


                                                                         *     *     *

So here is the problem with graphing on the Argand, or Complex plane. A plane

has 2 dimensions, an x and a y. When dealing with complex numbers, it takes 2 axis

just to position a point with the real part on the x-axis, and the imaginary on the vertical. 

So it actually takes 4 dimensions to illustrate a simple complex function.

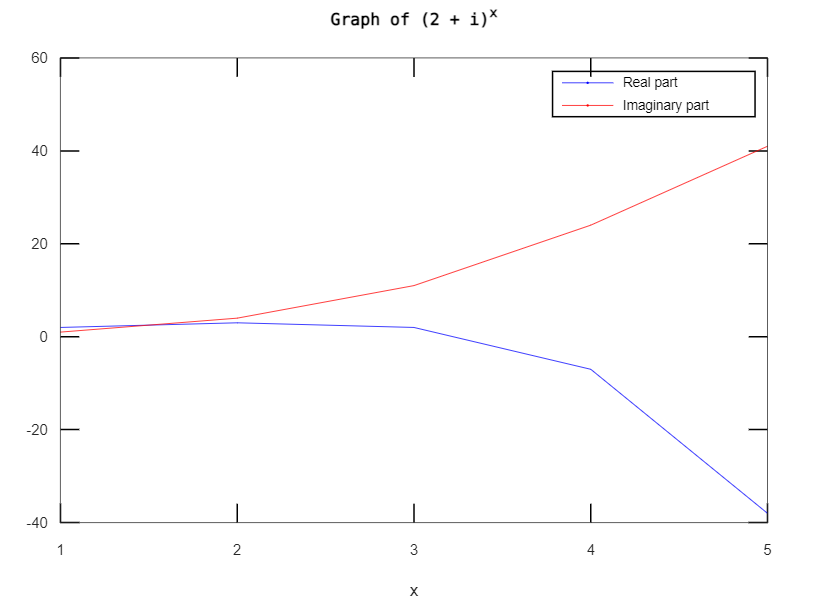
Octave, below, handles this by showing a 'reals' plot and an 'imgs' plot in different

colors:


I might ask python/numpy to produce a values table for me...

                                                                 *     *     *

Bard's code and output:


Bing's code and output:


No comments: