reference plane-intersect with center a 0 can have 3 axes: x, y and z. And
one can refer to any point in that space with the usual sequence
of numbers (a, b, c) ; for example (4, -2, 3). One is then free
to do vectorial calculations in that space. That is the usual meaning
of 3-D graphing.
In working with complex numbers, it is also possible to graph in
3-D but in this case, the resulting construct needs to show transformations
on both the real and imginary values at the same time. Frankly unreadable
for particular values, in my view, but giving a sense of the whole. Which gives
rise to peaks and valleys, color intensity, contour maps and so on. À chacun.
* * *
In aid of clarifying what is at stake, I propose two problems: the first Cartesian,
the second, color intensity. Answers follow!
Problem 1:
I have cut a triangular mirror and placed it ia a corner. The reference points for
the corners of the mirror are (2, 2, 2), in feet. What is the surface of the mirror.


Geogebra computes the answer. Otherwise:
Each of the sides is of length 8^.5 by Pytagoras
A line dropped from the apex to the base will be
of length 6.007^.5 = 2.451
The triangle must be (1/2)*2.46*2.83 = 3.48

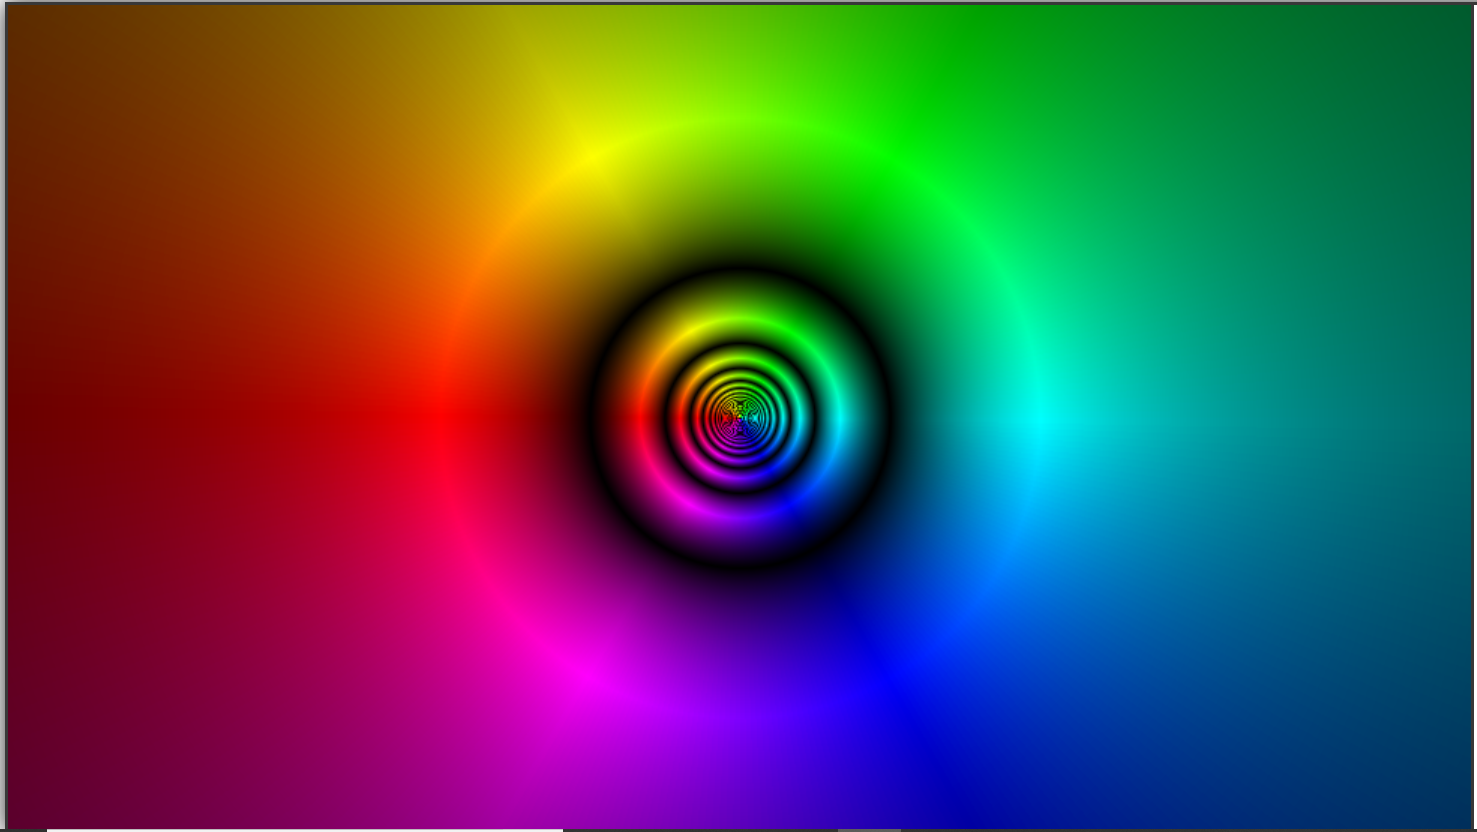
Problem 2:
I heve generated color intensity maps of these three functions. Match the mapswith the functions.
1. 1/z...
2. gamma(z)...
3. sin(z)...
A-

B-

C-

For comparison:
With modulus .5
With modulus 2

* * *
No comments:
Post a Comment